Different Forms, Same Function, But Abiding By Identical Limits

The Dude abides.
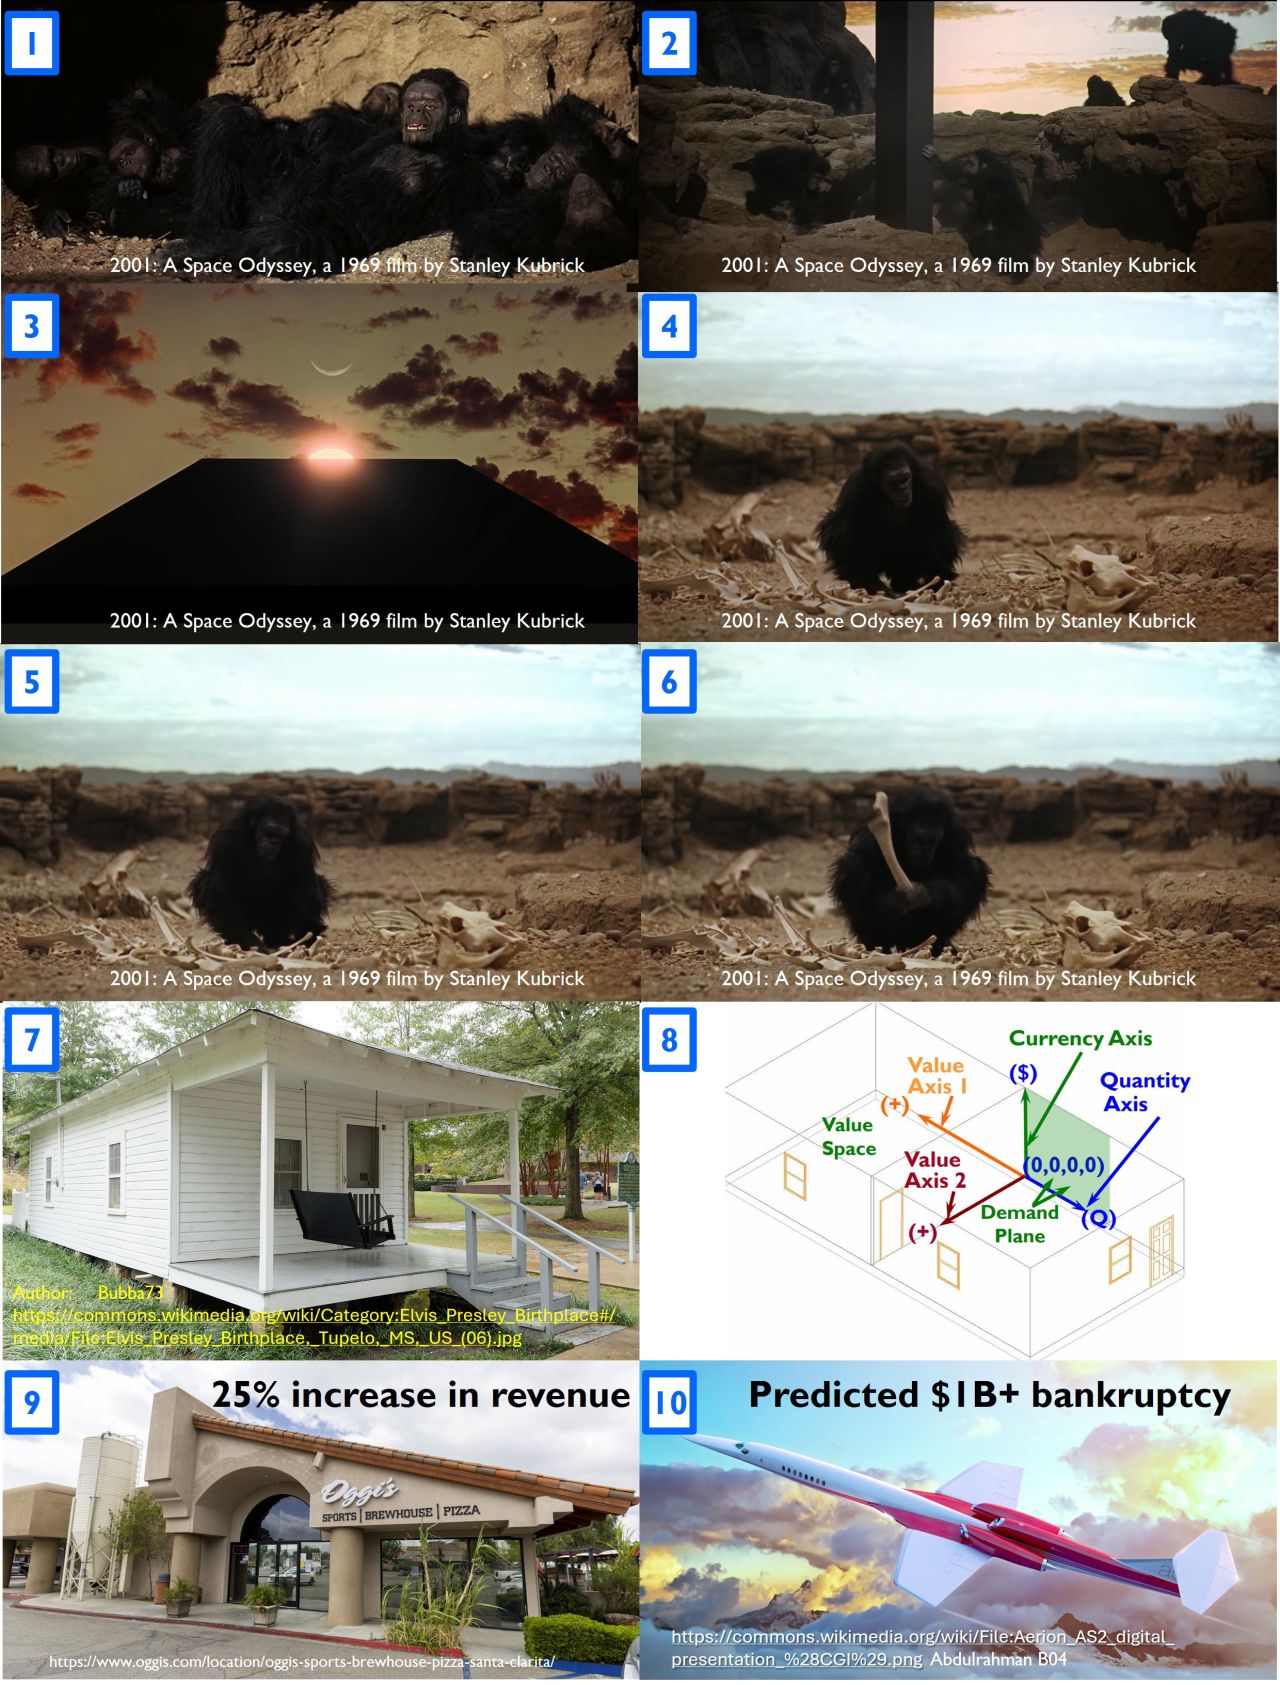
The Dude, from The Big Lebowski

We’ve seen it over and over again.

A new product is entering the market, and everyone who helped bring it to life believes it will revolutionize the industry. And, with respect to its Value (i.e., its sustainable price based on its features), they often do.

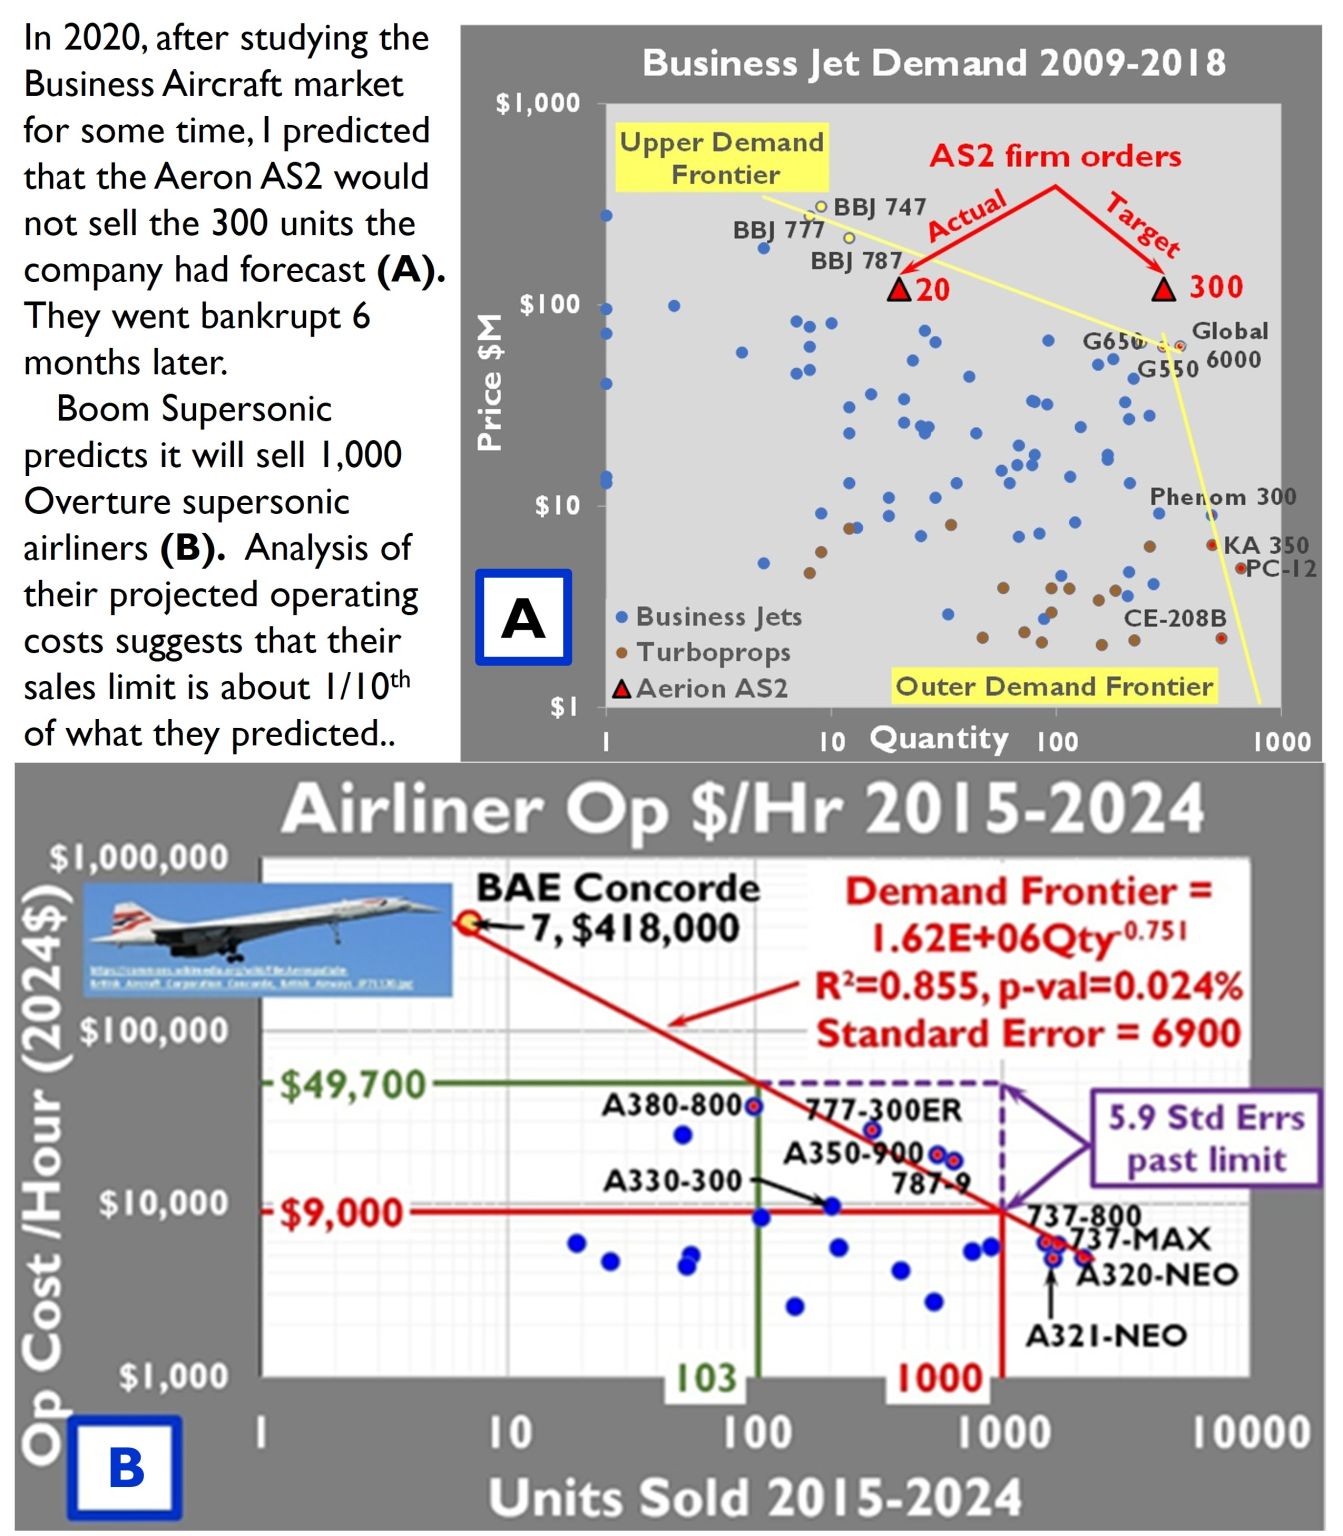
The supersonic Concorde sold for $46M (in 1977), compared to the subsonic McDonnell Douglas DC-9 ($7.6M in 1977), which carried the same number of passengers.

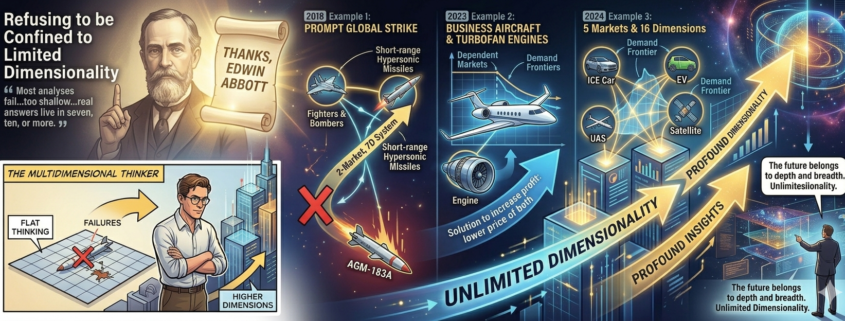
The hypersonic AGM-183A missile, at $42M (2016$), costs more than the high subsonic AGM-158-1 JASSM-ER, at $1.9M (2016$).

The Concorde was projected to sell 350 units. They sold 14. Meanwhile, the DC-9 sold 976 units.

The Congressional Budget Office saw a market for 300 AGM-183As. One was sold. The JASSM-ER has sold 3360 units to date.

In both cases, the Demand Curves weren’t broken. They were instead ignored. Had those curves in those timeframes been properly characterized, neither program should have launched.

At the beginning of the modern era of mass-produced electric cars, many saw the market as brand-new.

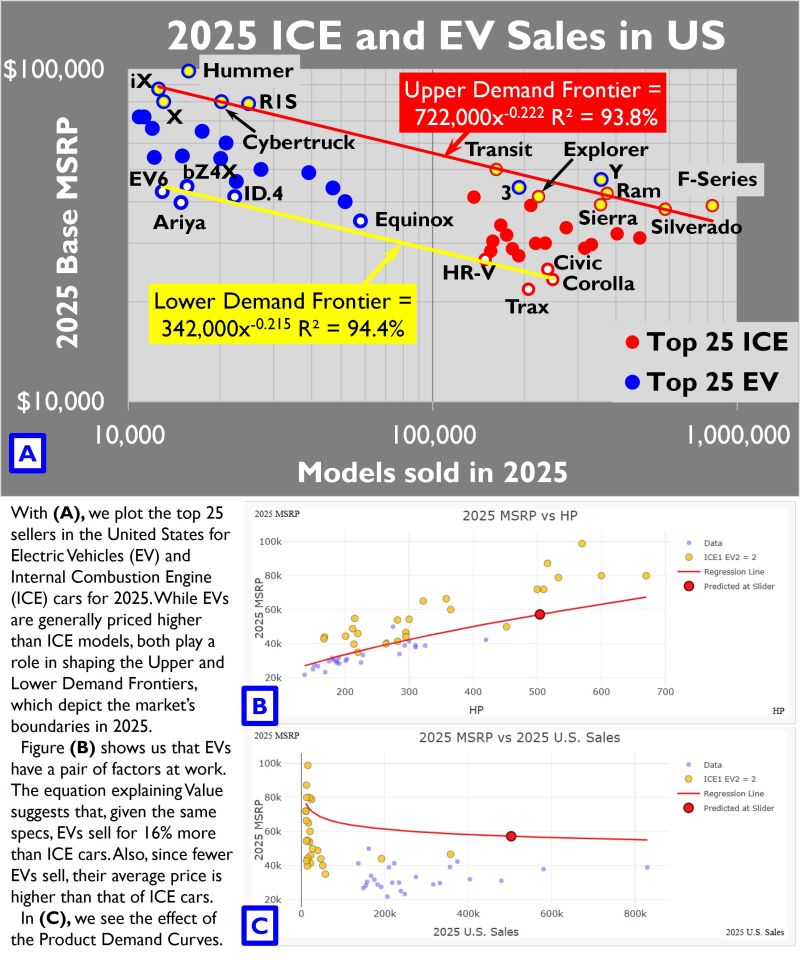
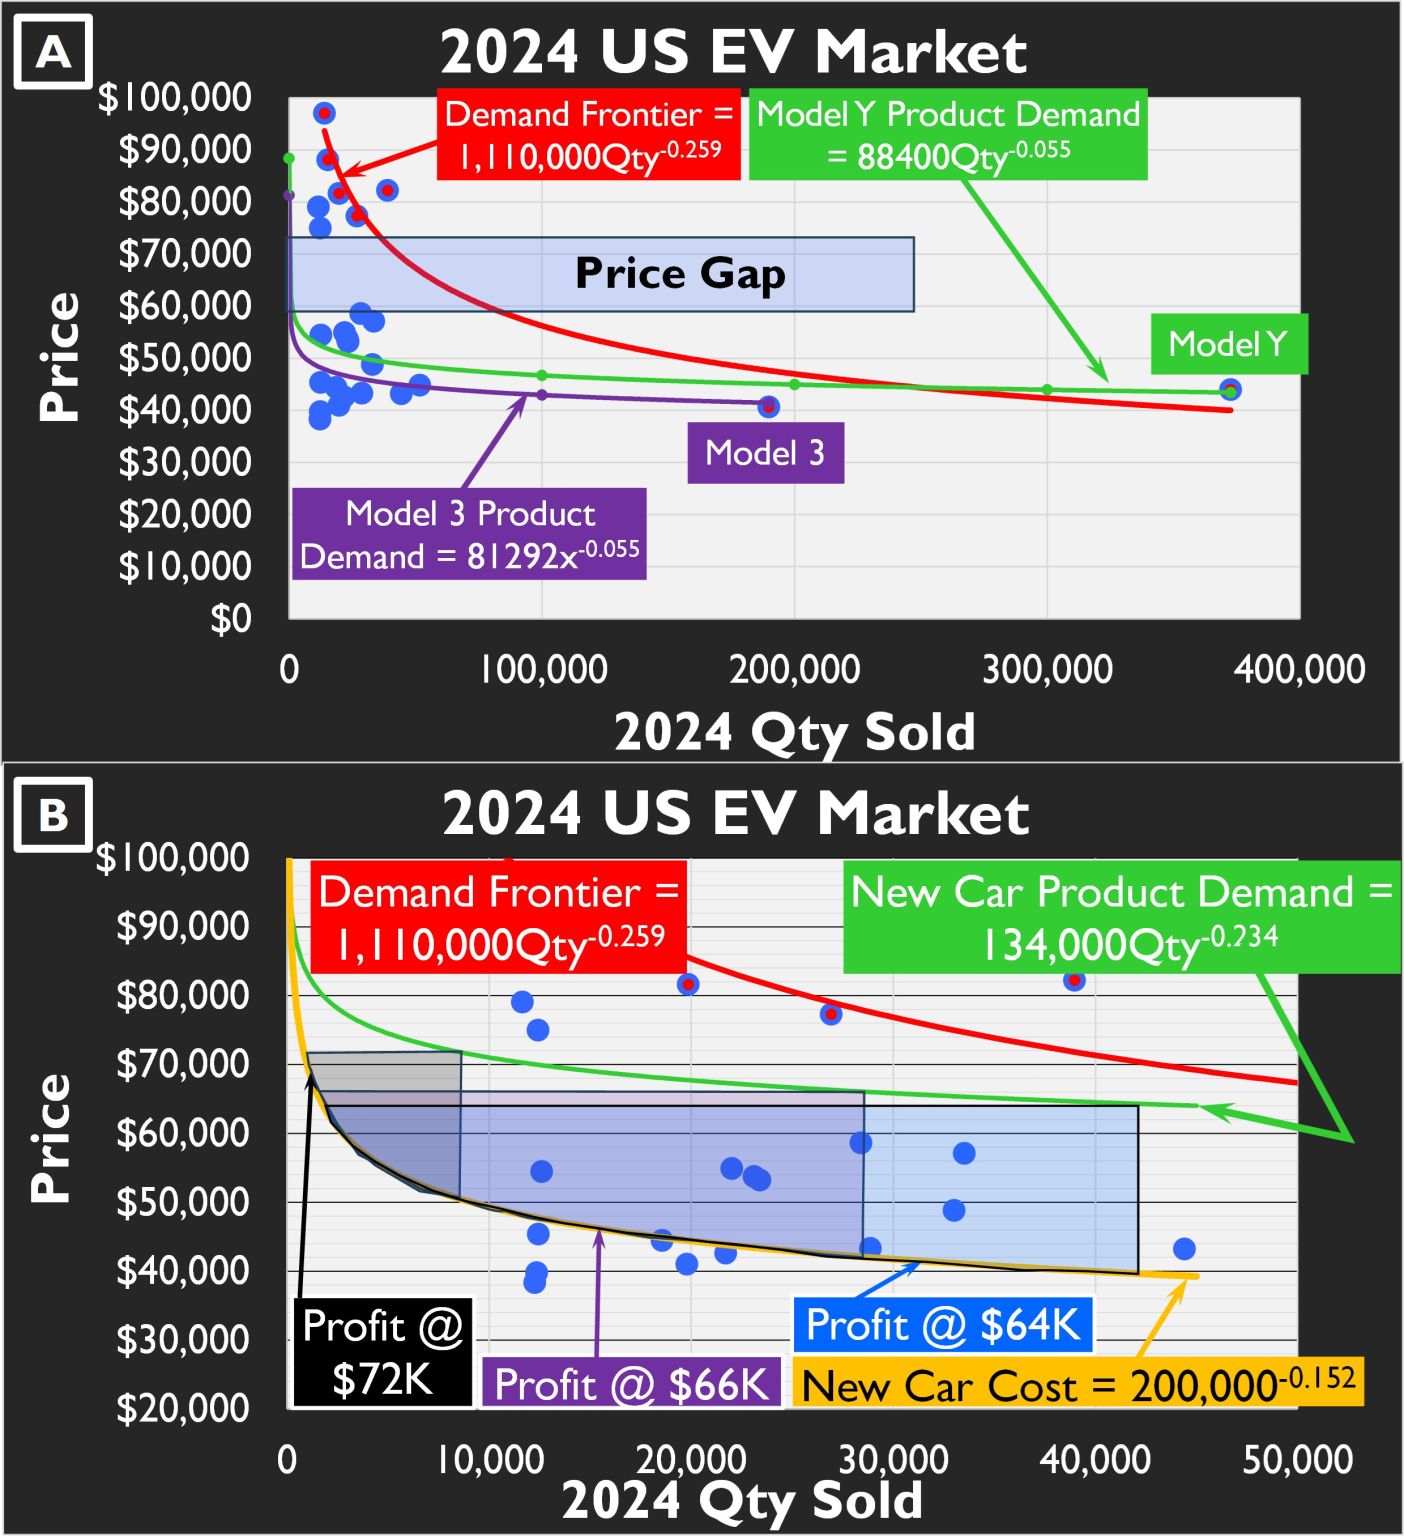
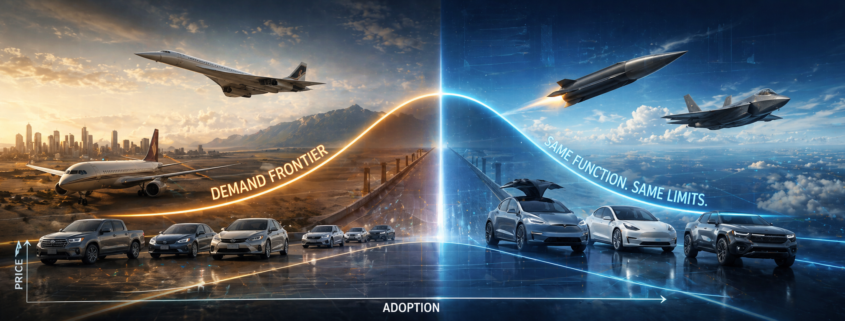
But, as we see in Figure (A) below, while the top 25 sellers of Electric Vehicles (EVs) in the US command higher prices than the top 25 Internal Combustion Engine (ICE) vehicles, both are bound by the same Demand Limits. At the lower end of the market, a group of EVs (EV6, Ariya, Equinox, etc.) joins a similar group of ICE machines (including the Trax, Corolla, and Civic) to form the Lower Demand Frontier. The Upper Demand Frontier is formed by, among others, EVs such as the Tesla X and Hummer at the high end, and the Model 3 and Y at the low end, with familiar ICE market leaders, Ram, Sierra, and the F-Series.

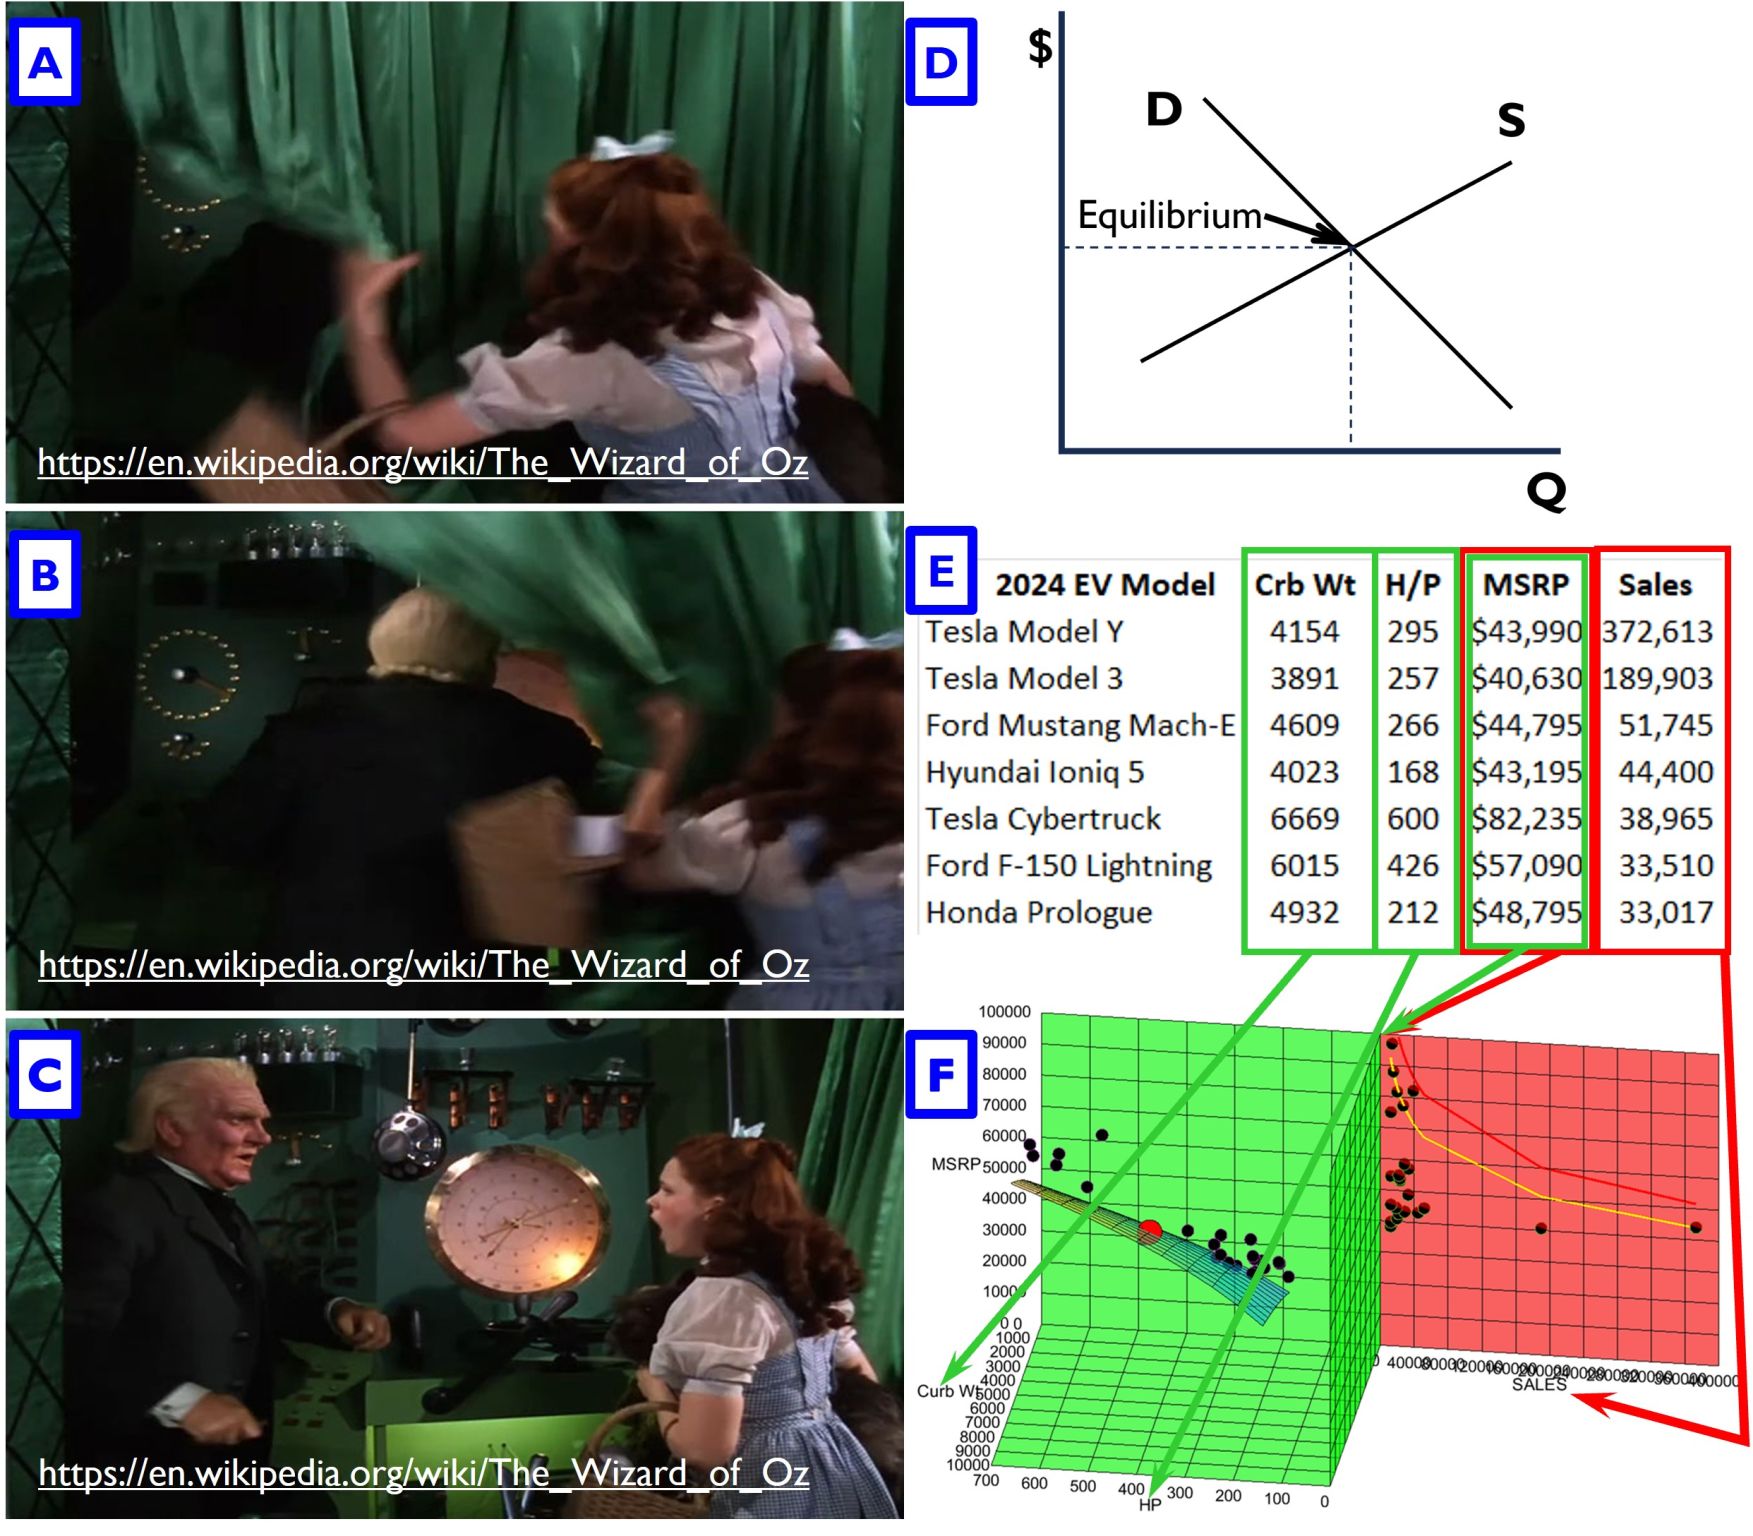
The ability of the Models 3 and Y to sell so many models is both a testament to Tesla’s low costs, along with the market’s overall Value proposition, which, for the 50 models studied, is:

2025 MSRP = 3780*HP^0.574 * ICE1 EV2^0.211 * 2025 U.S. Sales^-0.076

The Sales Term (U.S. Sales-0.076) rounds to the equivalent of a 95% Product Demand Curve. At the same time, the industry typically demonstrates an 85% Learning Curve. Thus, Prices will not fall as fast as costs, meaning that the overall Upper Demand Frontier forms the market limit.

With the Lower and Upper Demand Frontier slopes of -0.22, the market offers far more money at its lower end than at higher prices. Will these slopes continue at the same rate if new, low-cost machines are added to the lower end of the market, or will the market experience steep downward breaks in its Demand Frontiers, as we’ve seen in Business and General Aviation aircraft, revealing that the market has reached saturation?

Designers of the next model entering the automotive market must understand its limits.

The Dude abides.

You should, too.

#evs #ice #hypernomics #demand

What if our competitors understand our markets better than we do?

Research is to see what everybody else has seen, and to think what nobody else has thought.
Albert Szent-Gyorgyi

Ten years ago, a Chinese national was convicted of stealing sensitive data from Lockheed Martin—data that contributed to the development of the Chengdu J-20 stealth fighter.

Today, reports suggest China is aggressively acquiring U.S. AI capabilities.

This pattern isn’t random.

Nations don’t steal everything.

They steal what they believe will matter.

Beginning years ago and continuing to this day, I have received multiple, highly similar outreach requests from Chinese academics—fully funded by their government—seeking access to my research.

I declined—every time.

But looking back, what stood out wasn’t the request.

It was the pattern.

These weren’t casual inquiries.

They were focused on financial systems, resource allocation, and optimal market boundaries—the exact areas where competitive advantage is determined.

That raises an uncomfortable question:

What if our competitors are investing more effort into understanding how markets actually work… than we are?

Because most Western analysis still treats markets as equilibrium systems.

But markets don’t behave that way.

They have limits.

They have boundaries.

And companies fail when they exceed them.

These boundaries are called Demand Frontiers.

Ignore these limits, and you get the next Airbus A380. In 2000, after watching Boeing sell 822 747s over the previous 20 years, Airbus decided to launch the A380, roughly 50% larger than the 747, which sold for a similar premium. Airbus predicted it would sell 1,250 aircraft over the project’s production run. They sold 251 and, in the process, lost 25 billion Euros. A detailed analysis of the Upper Demand Frontier of that market in 2000 indicated that their chances of reaching their target were well below 1 in 1,000.

In (A) below, Aerion tried to exceed what the business aircraft market would have allowed in terms of sales. They, too, ran afoul of the Demand Frontier. Their losses were roughly $1B to $2B.

Boom Supersonic, with its proposed Overture airliner (B), will face the same limit, crushing its bottom line. They’d like to sell 1000 of these supersonic aircraft. Having not studied the market limits, they are destined to sell a fraction of their goal.

If, instead of ignoring Demand Frontiers, firms actively analyzed and plotted them, they would find where the market actually supports success.

Say what you will about China, when it comes to civil aviation, they’ve not made the mistake of trying to outpace a market that clearly signals its limits.

So here’s the real issue:

If others are actively studying how to identify and exploit these limits…What happens to those who aren’t?

#iptheft #ip #hypernomics #newidea

Refusing to be Confined to Limited Dimensionality

Yet I exist in the hope that these memoirs… may find their way to the minds of humanity in Some Dimension and may stir up a race of rebels who shall refuse to be confined to limited Dimensionality.
Edwin Abbott Abbott (Author of Flatland)

Most analyses fail for a simple reason: They’re too shallow.

They describe complex problems in two dimensions…when the real answers live in seven, ten, or more.

Call me a rebel.

I refuse to solve multidimensional problems with flat thinking.

Over the last 15 years, I’ve found that once you start working in higher dimensions, something uncomfortable happens:

You can’t go back.

Because you start seeing where others are wrong.

In 2018, in Example 1, working on the then-pressing issue of “Prompt Global Strike,” I wrote of a 2-Market, 7D system consisting of adjacent markets for Fighters and Bombers (Market 1) and the missiles they carry (Market 2). I then discovered that the best (i.e., affordable) way to accomplish the mission was to develop short-range hypersonic missiles and deploy them from aircraft operating from multiple forward-based airbases. The problem with the missiles was that their cost went up dramatically with range. Ignoring this caution, the USAF went ahead with its 1000-mile hypersonic AGM-183A missile. It was canceled after one was built (as the analysis suggested in advance). The USAF is restarting this program. It was too expensive before. It will fail financially again.

With 2023’s Example 2, I dove into a pair of dependent markets, that for 1) Business Aircraft and 2) their Turbofan engines. There, I found that both a large business aircraft and its primary engine were hard against their Demand Frontiers. Since engines accounted for about 25% of the aircraft’s cost, if the recurring costs for both were sufficiently low, the solution to increase profit was to lower the price of the plane and its engine simultaneously.

Example 3, issued this year, covered five markets and 16 dimensions simultaneously. Among other things, the work done there revealed that Internal Combustion Engine (ICE) cars and Electric Vehicles (EVs), despite having different product forms, both lie on the same Demand Frontier because they perform the same function. In the same vein, Unmanned Airborne Systems (UAS) performing reconnaissance shared the same Inner and Upper Demand Frontiers as satellites performing the same function. Who knew these platforms had common sales limits until we did the multidimensional analysis?

The future of finding the most profound insights belongs to those who can describe and solve problems with sufficient depth and breadth. Using unlimited Dimensionality enables that.

Thanks, Edwin Abbott Abbott.

#hypernomics #flatland #dimensionality

The Quest for Tools: That Moment of Discovery

Man is a tool-using animal. Without tools, he is nothing; with tools, he is all.
Thomas Carlyle

The theory of probability is the only mathematical tool available to help map the unknown and the uncontrollable.
Benoît Mandelbrot

Prospective clients often ask me, “Why should I use Hypernomics?” I say that Hypernomics helps you see your entire market in 3D (or multi-dimensions) — revealing where you’re overpriced, underpriced, or missing opportunities you and your competitors can’t see. In so doing, it replaces guesswork with visual clarity — letting users identify untapped niches before competitors do.

How can using a tool first benefit you?

In his landmark 1968 film, 2001: A Space Odyssey, Stanley Kubrick offers his vision of proto-humans discovering tools for the first time. Early in the film, the chief man-ape of the main tribe, known as Moonwatcher, suffers a defeat at the hands of a competing band of pre-humans at the watering hole he and his followers use. Isolating himself from the others, he sits below a rock outcropping, gazing up at the moon, perhaps searching for answers. The next morning, he wakes up and sees something before anyone else (1). A few seconds later, we discover a large monolith in front of him, which he is the first to touch (2). As we take another look at the monolith, we see it as Moonwatcher did, from its base, looking up, aligning with the sun and the moon (3). The next day, like many others before it, he forages among the bones of a dead animal, looking for something to eat (4). In an instant, he flashes back to the monolith aligned with celestial bodies (3). Now he looks at the bones from a different angle and a new point of view (5). Over the next few seconds, he realizes the bone can be a hammer or a club (6). This revelation that the bone can be a weapon enables him and his tribe to retake their watering hole.

I had long been aware of rectangular two-room houses like the one Elvis Presley was born in, Tupelo, Mississippi, structures commonly known as shotgun shacks (7). One day, I walked into a big-box electronics store. Maybe I wandered by a refrigerator with a pair of lights above it that mimicked Figure 3. Whatever the inspiration, a few minutes later, I found my wife was buying a washing machine by comparing its capacity, number of cycles, and price. I wondered what its sales were at that price compared to others. I realized then that she was performing a 4-dimensional trade in her head, done in the shell of something like the Elvis house (8).

So off I went to build Hypernomics, our 4D paradigm for describing markets using probability. It added 25% to a struggling restaurant’s revenues (9) and predicted the $1B+ bankruptcy of a company that tried to sell a supersonic business jet beyond its Demand Frontier (10).

Find out what Hypernomics can do for you.

I don’t go to my watering hole without it.

#marketanalysis #hypernomics #tools

Do you presume to criticize the Great Oz? Yeah. Count me in.

Professor Marvel never guesses; he knows!
Professor Marvel (aka The Wizard, from The Wizard of Oz)

Imagine you are a modern-day Dorothy going off to quiz the Wiz. His side gig as a Professor is no secret to you. You’ve been told of the Law of Supply and Demand, maybe second-hand from him. You want to know about it. You want to learn. What can he teach you?

Instead of counting on a tornado to get you and your dog to your destination, perhaps you take a Lyft in an Electric Vehicle (EV) from your house to the airport, fly to where the Wiz is, get off the plane, get in another EV, and stop at the yellow brick road.

As you walk into the Royal Palace, an unseen voice booms over loudspeakers: “I am Oz the great and powerful!”

“Yes. Right. Quite,” you say. “I also understand that you are a Professor. What can you tell me about Figure (D)?”

“Ah yes,” the voice bellows, “in all markets there is only one quantity-price point, where supply and demand meet, at equilibrium. It’s the Law of Supply and Demand, the law of the economic land.”

You say, “Let’s think about that. I took 2 different EV models to get here today. That means there wasn’t one equilibrium point in that market. At least two models are in use there, and we know there are many more, as shown in (E).

The room is fogged up, except for a curtained area in a corner (A). Your dog doesn’t like the look of it and pulls back the curtain (B), revealing Oz as nothing more than an ordinary man (C).

You march up and begin a conversation face-to-face.

“Why do you persist in touting a 2D model that can’t describe a market as ubiquitous as that for Electric Vehicles?”

“Well, what other system could there possibly be?” the Professor demanded.

You say, “That’s funny that you should ask. If we plot the last two columns of Figure (E), we get the Red Demand Plane in Figure (F). The first three columns from Figure (E) give us the Green Value Space in Figure (F). When we combine them, we have a market map in multiple dimensions, one that enables us to identify uncontested market spaces. It reveals where models are overpriced, underpriced, or gaps in the market that those not using such a map can’t see.”

The Professor starts to understand. “Why, now that you mention it, I can see no competitors in the price range from roughly $59,000 to $75,000. Is that what you call a ‘Price Gap’?”

“Yes,” you coach him along, “that’s a Price Gap. If you studied it from another angle, you’d find no competitor has a model with more than 426 horsepower but less than 516.”

“A Horsepower Gap?”

“Exactly,” you continue to encourage.

“So if we put up a new model with, say, 471 horsepower that was worth $67,000, the model reveals we have no direct competition?”

“Precisely,” you fire back.

“So, by creating this drawing, we are realizing insights we can’t see without it. Why aren’t we teaching this in school?”

“You tell me, Professor.”

#hypernomics #evs

Why Keep Prices Low

Always deliver more than expected.
Larry Page, Former CEO of Google

Have you ever wondered how Elon Musk managed to become the wealthiest person in the world?

I know I did.

In the space industry, we knew that by selling SpaceX launch platforms for less than their projected Value, Musk drove SpaceX revenue higher. How might that strategy work in the Electric Vehicle (EV) market?

I found the top 25 best sellers in the EV market in 2024. Suppose you were to try to predict the EV Value. If you did, you’d find that it goes up with horsepower (as expected), curb weight (not expected, but since virtually every model had a five-star rating, added mass was a measure of crash survivability), and model sales (the Value for each subsequent delivery falls).

In (A), we observe that this market forms a well-correlated Upper Demand Frontier, with Tesla Model Y and Model 3 commanding the low-priced portion, where most of the market’s revenue lies. Between them, they control over half the revenue that the top 25 models produce. A company can make more money if it can drop a model’s price and cost simultaneously.

Suppose you wanted to enter this market. While curb weights are well distributed across it, there are no vehicles with more horsepower than the Ford F-150 Lightning (Pro SR) at 426 horsepower, or less than the BMW iX (xDrive5) with 516 horsepower. The target for a proposed new model aims to split that difference. At the time of the study, no model was priced between the Cadillac Lyriq (RWD Tech) at $58,590 and the Tesla Model S (Dual Motor) at $74,990. Rather than compete head-on in highly contested market spaces, you could decide to put yourself roughly in the middle of both of the horsepower and price gaps, with a curb weight of 5,000 pounds, 471 horsepower, and projected sales of 28K units in a year, and a target price of $66K for a vehicle, as we do in (B). These specifications form a New Car Product Demand Curve (in Green, which comes from our recurring price term in the regression analysis for Value in these models) and an assumed New Car Cost (Learning) Curve. The difference between the price and the recurring costs is profit.

Our car is nominally worth about $66K. If we sell it for $72K, we get the profits in the black-shaded box in (B), with the earliest possible recurring breakeven point. If we sell it for $66K, as designed, recurring breakeven comes later, but we make more profit, as shown by the purple-shaded area. Paring the price down another $2K to $64K drives a delayed unit breakeven point, but profits (in the blue-shaded area) grow.

While there are additional factors to consider here (movements over time, network effects, feature packages, etc.), it is clear that Hypernomics unlocks previously hidden market patterns, enabling enhanced profits.

And who wouldn’t want that?

#hypernomics #ev #evmarket

ChatGPT on Hypernomics

ChatGPT is scary good. We are not far from dangerously strong AI
Elon Musk, X, 12/3/2022

A Google search is good, but a pointed question to ChatGPT is better. I asked it, “Why should a company or government agency use Hypernomics?” and it wrote:

Hypernomics, a powerful analytical approach leveraging hyperdimensional economics, offers companies and government agencies a transformative way to understand complex, multi-dimensional data. Here’s why they might choose to adopt Hypernomics:

ENHANCED DECISION-MAKING: Hypernomics helps organizations visualize and analyze data across numerous variables simultaneously, enabling a more nuanced understanding of factors affecting outcomes. This multi-dimensional insight supports more informed, strategic decisions, particularly when traditional two-dimensional analysis falls short.

IDENTIFYING MARKET OPPORTUNITIES: By analyzing consumer behavior, demographics, pricing, and product features, Hypernomics can uncover lucrative market gaps that would otherwise remain hidden, leading to more targeted products, services, and policies.

RISK MANAGEMENT & FORECASTING: With Hypernomics, organizations can better forecast potential risks and outcomes by understanding the interplay between various factors. This approach aids in scenario planning, helping agencies and companies anticipate and prepare for future scenarios.

RESOURCE OPTIMIZATION: Hypernomics can help governments allocate resources more effectively, for example, by optimizing infrastructure investment based on factors like population growth, economic activity, and regional needs. Companies can similarly use it to streamline operations, optimize supply chains, or refine pricing strategies.

COMPLEX PROBLEM-SOLVING: Complex issues, like climate change impacts or multi-market competition, require the analysis of many variables. Hypernomics enables organizations to solve such challenges more effectively, revealing connections and insights that other methods may overlook.

COMPETITIVE ADVANTAGE: For businesses, the ability of Hypernomics to analyze vast, interconnected datasets can provide a significant edge, offering insights that competitors may lack. Government agencies benefit by understanding societal needs comprehensively, improving public service delivery and policy impact.

The math behind Hypernomics, while complex, is essential to its application in real-world decision-making and enables organizations to envision relationships and dependencies that would otherwise go unnoticed, paving the way for a more profound and actionable understanding of their data. That math enables Hypernomics to deliver insights that are both broad in scope and granular in detail.

Hypernomics provides a framework to navigate and leverage multi-dimensional data, allowing companies and government agencies to move beyond traditional methods for a more comprehensive, insightful, and strategic approach to decision-making.

#chatgpt #hypernomics

Stop Lying to Students

If you are out to describe the truth, leave elegance to the tailor. (On being reproached that his gravitation formula was longer and more cumbersome than Newton’s.)
Albert Einstein

So, I’ve combed through all the big sellers used as economics textbooks and discovered that they all agree that we should portray Demand the way they show it in Figure A. It has remained unchanged since Alfred Marshall wrote Principles of Economics in 1890.

The jury is in. The verdict read. Everyone agrees! It’s so simple! So self-evident! So elegant!

And yet, so wrong.

You’d think a world deep in the middle of its Information Age would want its Demand Curves to be informed with data. Figure (A) is not so drawn. If it were only the case that the convention in (A) was a harmless yet broadly accepted lie, I might be inclined to let it go.

But it isn’t. Students are being led astray. Markets aren’t that straightforward.

To analyze them, you need to do more work.

Figure (B) shows what happens when we do that work. Here, we examine the leading currencies of the day and make several mathematically informed discoveries about currency Demand. There is not a simple single line describing it. In (B), we see four different curves at play. There are others still, but we won’t entertain them now.

The Upper Demand Frontier was formed by the currencies of three Gulf states, plus the Euro, the British Pound, and the United States Dollar. This boundary describes the Price-Limited market boundary.

THE OUTER DEMAND FRONTIER reveals the market’s saturation limits. Adding more units to a given currency tends to depress its Value (sustainable price in United States Dollar equivalents) along this curve.

THE INNER DEMAND FRONTIER exposes the minimum viable quantities of currencies given their prices. In essence, the world says that if you issue a currency, you are guaranteed at least its Value along this line.

THE JAPANESE YEN DEMAND CURVE (yes, there is one for every country shown; we’re only looking at this one for an example) shows how the price of that country’s currency should rise or fall as the number of units enters or disappears from the market. We obtain the slope of that curve when we solve for the Value of all currencies, which is a function of each country’s

1) Prime rate,
2) Foreign Exchange Reserves, and
3) Currency volume.

Yes, this method is “longer and more cumbersome” than the simple line it replaces. Relativity is more complex than Newtonian mechanics. But, without relativity, you don’t get a Global Positioning System (GPS). And who wants to navigate without that?

Navigating markets takes hard work that others don’t yet imagine they have to do. But market math reveals its truths once we make that effort.

We need students to understand the real world of markets, not some oversimplified paradigm that leaves them partially informed yet confident they know how they work.

#hypernomics #markets #marketanalysis

The Semmelweiss Reflex – Rejecting New Evidence Opposing Established Norms

The new scientific truth does not triumph by convincing its opponents and making them see the light, but rather because its opponents eventually die, and a new generation grows up that is familiar with it.
Max Planck

Kurt Vonnegut called him “my hero.” His birth house is now a museum named for him. Many wrote about him, and last year, over 150 years after he died, there was a play about him in London. But Dr. Ignaz Semmelweiss did not enjoy this popularity when alive.

After earning his medical degree, Vienna General Hospital appointed him to their First Obstetrical Clinic in 1846. Made of 2 units, the 1st clinic, run by midwives, had a much lower mortality rate than the 2nd, operated by doctors. After much research, he suspected that doctors going from their cadaver lab directly to the maternity ward might have led to the transfer of “cadaverous particles” to maternity ward patients, as midwives in the 2nd clinic had no such contact with corpses. He suggested that doctors wash their hands. When they initiated that procedure in the first clinic, its mortality rates plummeted.

However, colleagues broadly mocked his hypothesis that only hygiene mattered. At the time, his theories lacked scientific explanation. That became possible after his death when Louis Pasteur and others developed the germ theory of disease.

Outraged by the apathy of his colleagues, he became dejected and drank heavily. He was committed to an insane asylum where guards beat him until his hand got gangrene, which quickly killed him.

The rejection of his observations was so severe that it came to be named the Semmelweiss Reflex, the affinity of people to cling to discredited beliefs.

I know something about that. I’ve taken my book to some big-name graduate schools. They won’t say it’s wrong. They just won’t read it. Thus, I’ve seen my paradigm-shifting observations undisputed but largely ignored. That reaction persists despite my undeniable mathematical evidence proving those previously held theorems false and incomplete.

At the lower left below, here’s an example homework problem for a current economics class that wants students to explain a “change in market equilibrium.”

Note the complete lack of data. Everything in the diagram is imaginary. Where is the information about the cars? Nonexistent. Oops.

Markets form with actual data, as shown in the lower right diagram. There, 18 electric car models for sale had points in Value Space (green spheres) describing their 1) Range, 2) Horsepower, and 3) Price, with matching points (red spheres) on the Demand Plane depicting their 3) Prices and 4) Quantities sold. There is no “equilibrium point,” as models enjoy “sustainable disequilibria” when prices exceed costs.

Unlike Dr. S, the rejection won’t drive me mad. But I am curious about the apathy.

And I wonder, as Semmelweiss did, who will wash their hands first?

#semmelweiss #hypernomics

Position to Win by Finding Open Market Spaces

Hit ‘em where they ain’t.
Wee Willie Keeler

You may not have heard of Wee Willie Keeler, but he changed baseball.

With over 63 at-bats between each strikeout over his career, he could bunt any ball pitched to him. Because of him, baseball stopped allowing unlimited bunt fowls and made one with two strikes a strikeout. He hit .300 16 times and .400 once. His record of 206 singles in a season stood for over 100 years. When Joe DiMaggio set his 56-game National League hitting streak, he broke Keeler’s 45-game record. He used one of the largest bats in the league, weighing up to 46 ounces.

And he did it all despite his diminutive size of 5’ 4 1/2” and weighing just 140 pounds.

His famous adage of “hit ‘em where they ain’t” applies not only to batting but also to marketing new products. It makes little sense to try to copy a competitor and offer a virtually identical product for a lower price when one can offer the market a new item that it wants, doesn’t have, and can afford.

To do that, we’ll need to describe our markets thoroughly.

In the case below, we’ll start with a fully assembled dataset describing the USG purchases of air-to-surface glide bombs (brown) and missiles (blue) over the 20 years beginning in 1997 and ending in 2016.

Imagine we are trying to sell a new missile. What can we give the market that it doesn’t already have?

In (A), we plot the range of the missiles in the set on the horizontal axis and their prices on the vertical axis. Instantly, we discover a critical fact: a substantial gap in missile prices. The USG has purchased cheaper and more expensive devices; it stands to reason that they might buy a new missile within this space with the appropriate features. In the same plot, we see that a similar opening exists relative to the range of these devices.

Figure (B) offers the same kind of insight that (A) does while looking at a different independent variable, launch mass. While the price gap in (B) is the same as in (A), in this view, we discover a sizable gap in the market’s launch masses. By interpolation, given that it performs well, a new product with mass in this gap will likely find a market.

(C) finds that the market for Air-to-Surface missiles has Upper and Inner Demand Frontiers. If we wanted to build, say, a missile that could sell as many as 28K units for an average price of $300K over 20 years, we find (once we do regression analysis considering 1) mass, 2) speed, 3) range, and 4) quantities sold, and set the Values for those first three independent variables, not shown here) this market has a Product Demand Curve that forms for each item. With a slope of -0.208, it is analogous to an 86.6% learning curve.

Thus, if a supplier can demonstrate a steeper learning curve than that throughout the program, they have the potential to meet their 28K unit limit goal at $300K along the Upper Demand Frontier.

#hypernomics #pricetowin #gapanalysis