The Quest for Tools: That Moment of Discovery
Man is a tool-using animal. Without tools, he is nothing; with tools, he is all.
Thomas CarlyleThe theory of probability is the only mathematical tool available to help map the unknown and the uncontrollable.
Benoît Mandelbrot
Prospective clients often ask me, “Why should I use Hypernomics?” I say that Hypernomics helps you see your entire market in 3D (or multi-dimensions) — revealing where you’re overpriced, underpriced, or missing opportunities you and your competitors can’t see. In so doing, it replaces guesswork with visual clarity — letting users identify untapped niches before competitors do.
How can using a tool first benefit you?
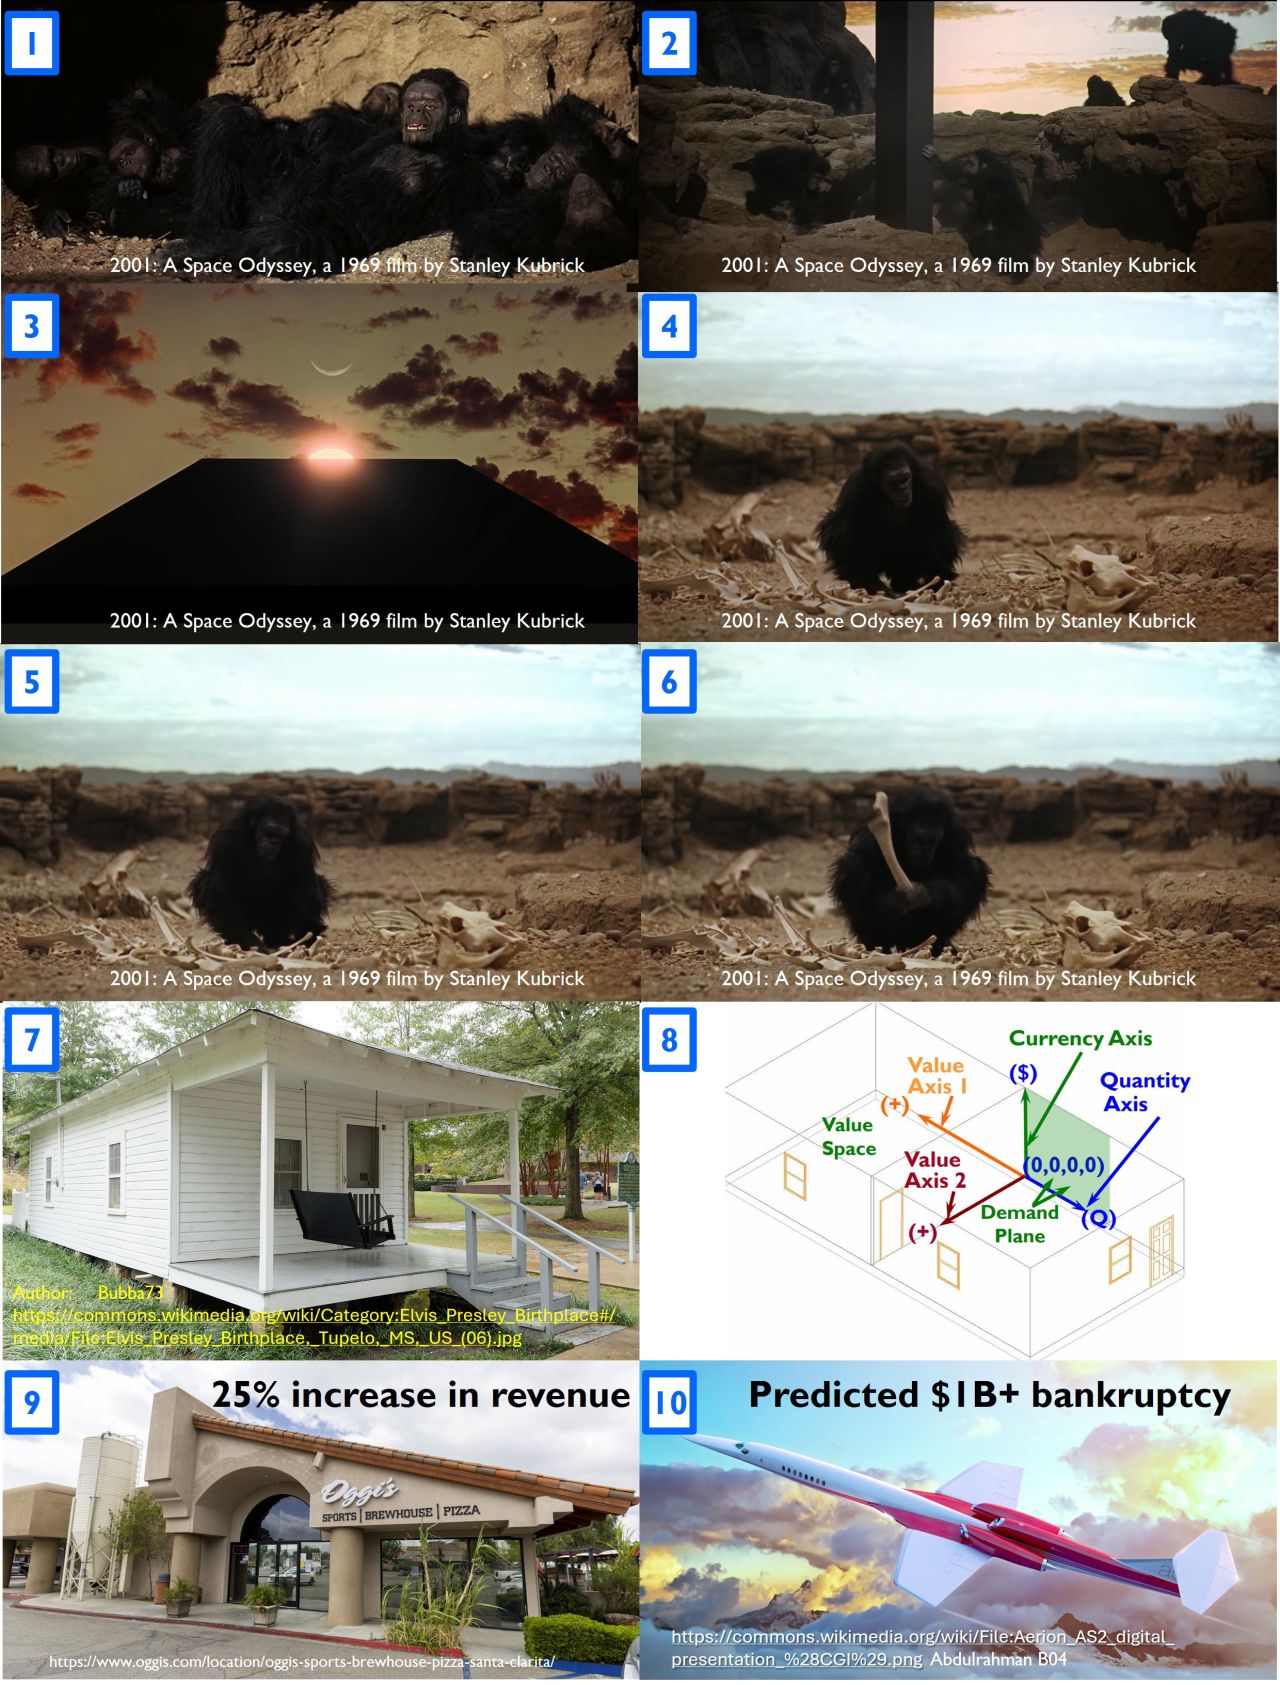
In his landmark 1968 film, 2001: A Space Odyssey, Stanley Kubrick offers his vision of proto-humans discovering tools for the first time. Early in the film, the chief man-ape of the main tribe, known as Moonwatcher, suffers a defeat at the hands of a competing band of pre-humans at the watering hole he and his followers use. Isolating himself from the others, he sits below a rock outcropping, gazing up at the moon, perhaps searching for answers. The next morning, he wakes up and sees something before anyone else (1). A few seconds later, we discover a large monolith in front of him, which he is the first to touch (2). As we take another look at the monolith, we see it as Moonwatcher did, from its base, looking up, aligning with the sun and the moon (3). The next day, like many others before it, he forages among the bones of a dead animal, looking for something to eat (4). In an instant, he flashes back to the monolith aligned with celestial bodies (3). Now he looks at the bones from a different angle and a new point of view (5). Over the next few seconds, he realizes the bone can be a hammer or a club (6). This revelation that the bone can be a weapon enables him and his tribe to retake their watering hole.
I had long been aware of rectangular two-room houses like the one Elvis Presley was born in, Tupelo, Mississippi, structures commonly known as shotgun shacks (7). One day, I walked into a big-box electronics store. Maybe I wandered by a refrigerator with a pair of lights above it that mimicked Figure 3. Whatever the inspiration, a few minutes later, I found my wife was buying a washing machine by comparing its capacity, number of cycles, and price. I wondered what its sales were at that price compared to others. I realized then that she was performing a 4-dimensional trade in her head, done in the shell of something like the Elvis house (8).
So off I went to build Hypernomics, our 4D paradigm for describing markets using probability. It added 25% to a struggling restaurant’s revenues (9) and predicted the $1B+ bankruptcy of a company that tried to sell a supersonic business jet beyond its Demand Frontier (10).
Find out what Hypernomics can do for you.
I don’t go to my watering hole without it.
#marketanalysis #hypernomics #tools