Solving the 1st Half of the Problem to Get to the 2nd

A problem well stated is a problem half-solved.
Charles F. Kettering

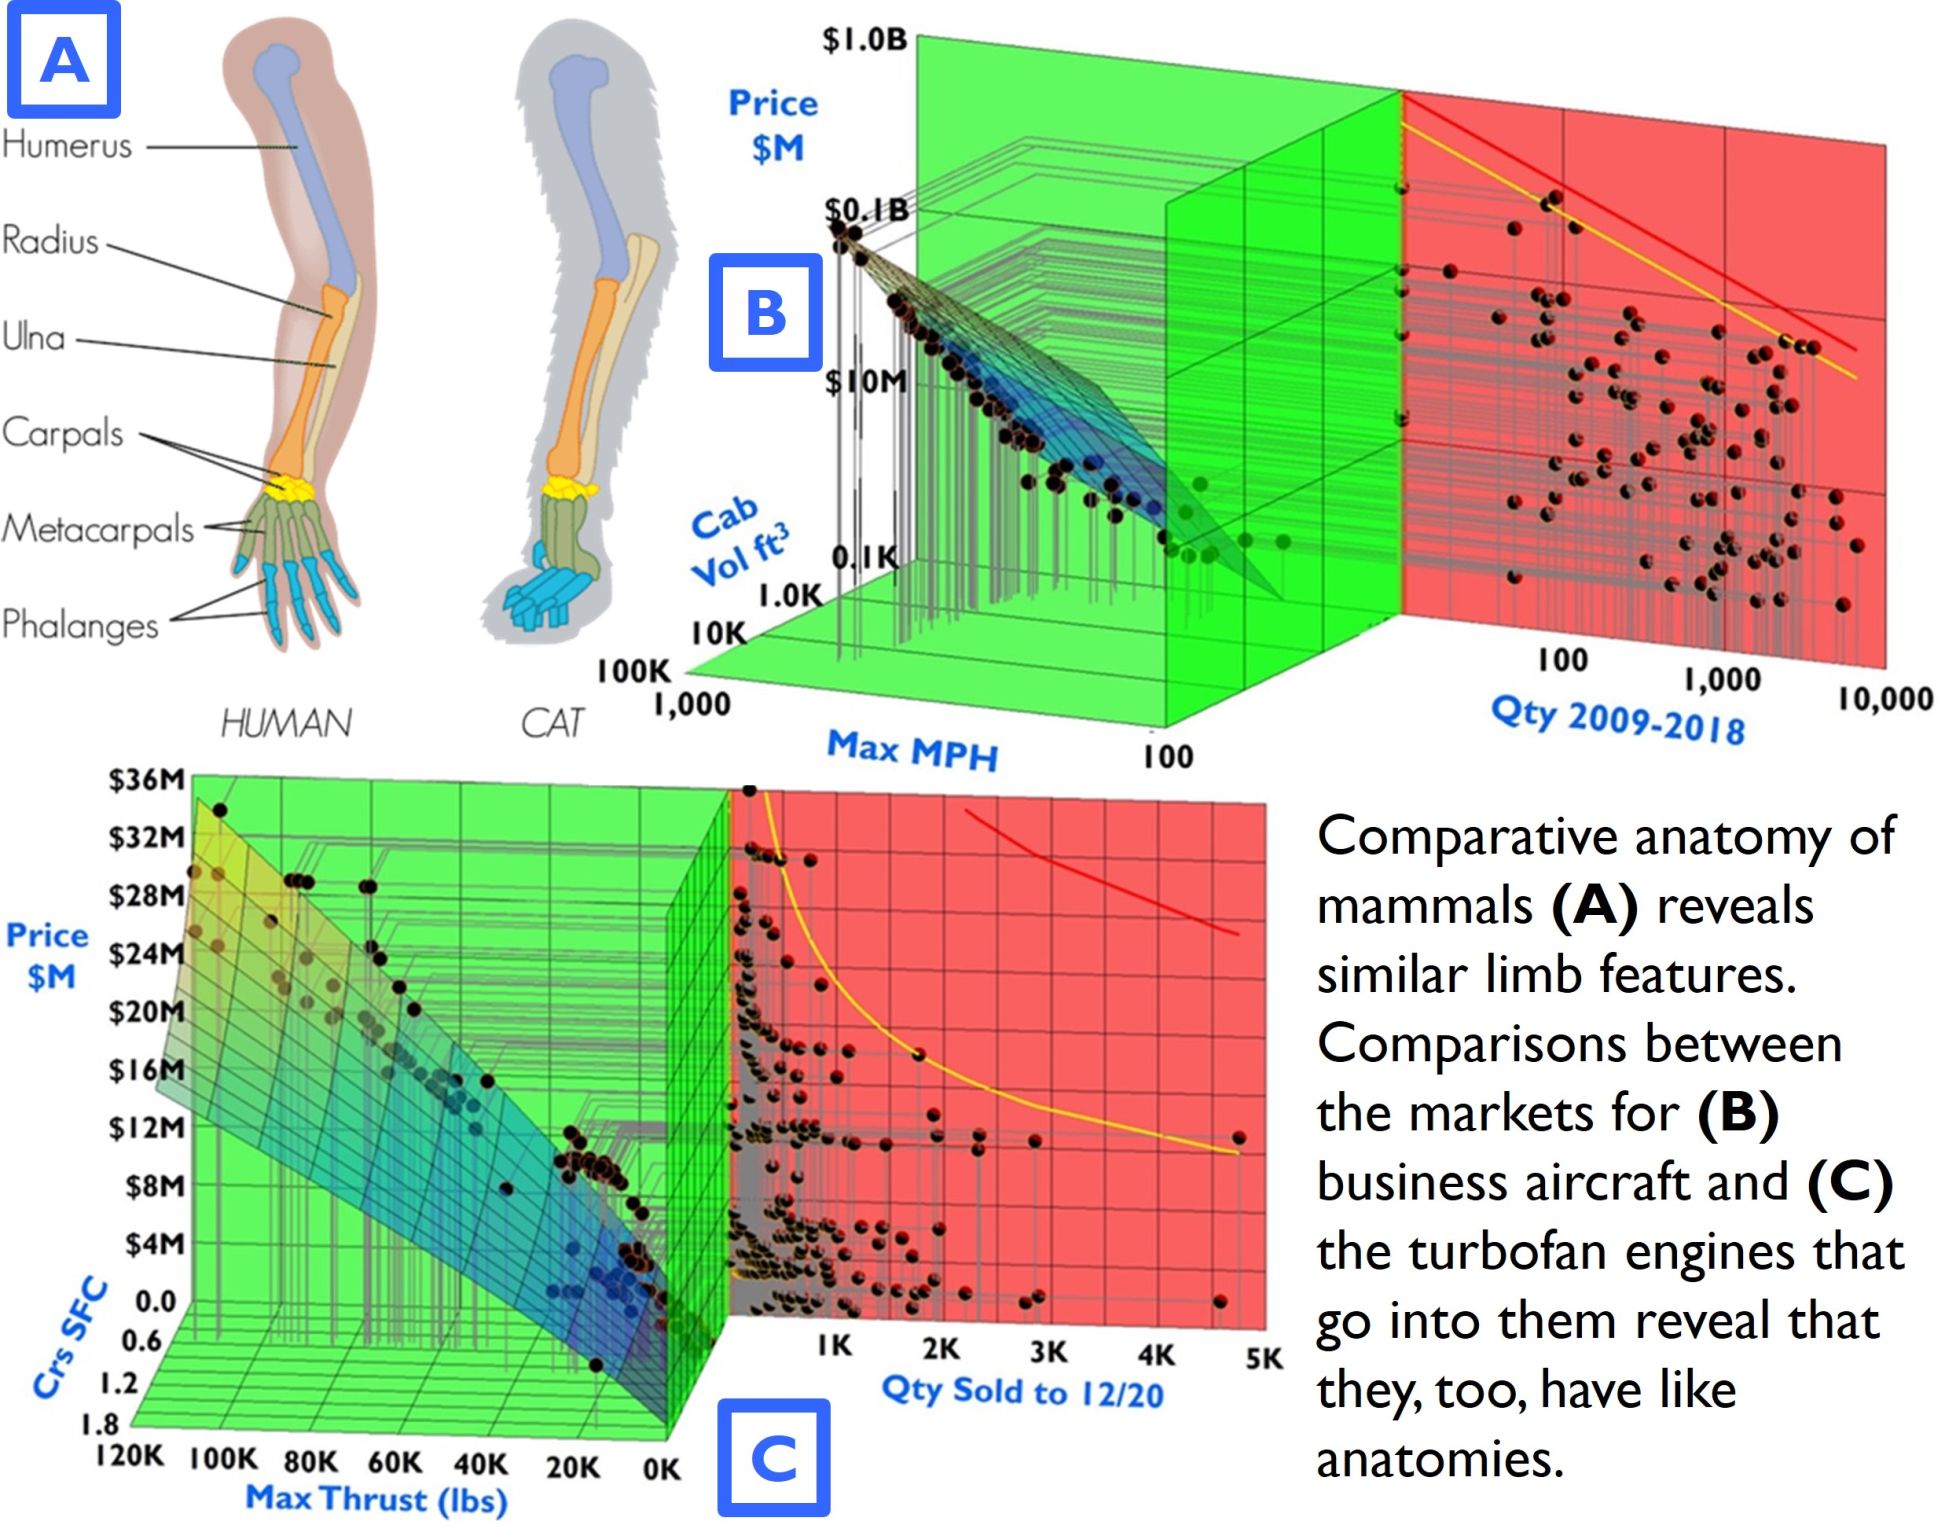
A few months ago, I wrote about the ill-fated AGM-183A hypersonic missile. While its engineering parameters were well-known, its budget limitations were not. Funded to about $1.7B for its development, Lockheed Martin said its first unit cost would be about $42M. At the same time, the Congressional Budget Office thought the USG would be able to afford 100 of them at their eventual per-unit price of $15M to $18M. As a variation of the chart below revealed (C), the chance of that happening was significantly less than one in one million quadrillion, as that price put it at 108 Standard Deviations past the market’s Upper Demand Frontier. Eventually, budget realism entered the picture, and the United States Air Force stopped funding the program. In the process, it validated their Demand Frontier.

For all the work we spend extending the boundaries of engineering, we must understand that trying to exceed a well-defined Demand Frontier by leaps and bounds never works.

To know what we can do, we must first know what we can’t. That’s part of the 1st half of the problem. The AGM-183A didn’t get past that.

LM did quite a bit better with its stealthy AGM-158B, also known as the JASSM-ER, in (A) below. At the time of the study, it was the most expensive air-to-surface missile in the industry. In the 20 years shown in (C) (1997-2016), LM sold 275 units at an inflation-adjusted 2024 price of $2.5M, with the AGM-158B helping to form the market’s Upper Demand Frontier. Note that that curve is relatively flat, with a slope of -0.533. That meant the USG spent more money on the market’s lower-priced part than its upper bit.

A recent headline noted that Russia knocked down over 150 Ukrainian drones. The ineffectiveness indicates the need for missiles to be invisible to the enemy. Getting smaller and stealthier will help.

Enter the prospect of much smaller, less expensive, and (presumably stealthy) cruise missiles, the air-to-surface (specifically, anti-ship) ordnance proposed by American defense startup Ares Industries shown in (B). Designed to attack smaller vessels, the company has set a target price of $300K per missile. Of course, whether or not they pull this off remains to be seen, but the attempt is admirable, as the low price enables the purchase of up to tens of thousands of units over two decades (C). It would add flexibility in the inventory, letting operators swap expensive devices for cheaper ones when smaller packages can do the job.

In (C), since Glide Bombs cost a fraction (about 1/8 for the same payload*velocity and range) of missiles, planners can afford to buy more of these devices than powered missiles. One could imagine a future in which stealthy glide bombs dropped from unmanned drones would lower operational costs and pilot risk while increasing mission success rates.


Market Limits and Infinite Dimensional Compression

Genius may have its limitations, but stupidity is not thus handicapped.
Elbert Green Hubbard

The International Cost Estimating and Analysis Association (ICEAA) recently held its annual Professional Development & Training Workshop in Minneapolis, Minnesota. This event, a cornerstone of professional development for our members, was a remarkable success. I submitted a paper to it, and it won the award for best paper overall.

Market Dimensional Expansion, Collapse, Costs, and Viability” delved into several crucial yet under-explored areas. Dimensional expansion and collapse are vital to comprehending market evolution. In it, I unveiled a groundbreaking method to compress standard 3D Cartesian Coordinate Systems into as many as 16 dimensions. Theoretically, there is no upper limit to the number of dimensions that can be depicted using these methods. Equally significant was the exploration of multiple views on Demand Frontiers.

In (D), I plotted the ten-year demand figures for 95 Western Bloc business aircraft, with the horizontal axis for their quantities and the prices on the vertical. Several crucial limitations become evident when one does that.

An Outer Demand Frontier reflects the market’s saturation threshold. Any model attempting to exceed this line will find that the market has exhausted its buyers. One can drop one’s price and gain more sales, but this line is very steep and will soon intersect any Learning Curve associated with the aircraft model that forms it. Note that none of the planes in the study vastly exceeded this limit.

The Lower Demand Frontier reveals a market’s margin limitation. There are planes priced below this line but fall into the General Aviation category. They are not for business travel due to the stricter regulations by which Business Aircraft abide.

Inner Demand Frontiers are efficiency-limited. Planes to the left of this line are either 1) reconfigured airliners (where the main airliner line keeps the learning going), 2) ramping up production, 3) winding down their line, or 4) underwritten by governments. In this case, all Textron planes are going extinct, as the company gave up building these aircraft types. The Dassault planes benefited from a large subsidy from the French government, and Piaggio got the same treatment from the Italian state.

The Upper Demand Frontier is the limit that took down the Aerion AS2, as it attempted to go far beyond it. In a different market, this made the B-2 bomber stop at 21 units rather than the 132 vehicles the USAF sought.

In sum, it pays to know where your contest’s boundaries lie. In markets, as in competitive games, there are boundaries. In business, your buyers form those boundaries. Knowing what your buyers can and can’t afford is critical to developing a product with a chance for success.


In (A), I hold a 2D Demand Plane in one hand, and a 3D Value Space in the other. The paper I gave using this concept won the awards in (B), allowing me to speak to 450 People (C). Among other things, my paper addressed markets’ Demand Frontiers (D).

Same Function, Different Form, Common Links

The moment of truth, the sudden emergence of new insight, is an act of intuition. Such intuitions give the appearance of miraculous flashes, or short circuits of reasoning. In fact they may be likened to an immersed chain, of which only the beginning and the end are visible above the surface of consciousness. The diver vanishes at one end of the chain and comes up at the other end, guided by invisible links.
Arthur Koestler

Invisible links. Poppycock. We don’t need no stinking invisible links.

For too long, many have thought market actions were largely mysterious, their forces hidden, and actions unpredictable. When it comes to product demand, that is complete nonsense. Even when collections of products look different but do the same thing, they behave in ways we can predict.

A Invisible links. Poppycock. We don’t need no stinking invisible links.

For too long, many have thought market actions were largely mysterious, their forces hidden, and actions unpredictable. When it comes to product demand, that is complete nonsense. Even when collections of products look different but do the same thing, they behave in ways we can predict.

A Raven UAV doesn’t look anything like a Topaz satellite. Yet, doing the same mission using different altitudes, payloads, and speeds, they are bound by the same Demand Frontier, one that limits the arena’s most highly rewarded performers. If you prove worthy enough to be on the field of play, you often find a certain lower guarantee of recompense, known as Minimum Demand.

Such boundaries are only mysterious if you don’t do Hypernomics. doesn’t look anything like a Topaz satellite. Yet, doing the same mission using different altitudes, payloads, and speeds, they are bound by the same Demand Frontier, one that limits the arena’s most highly rewarded performers. If you prove worthy enough to be on the field of play, you often find a certain lower guarantee of recompense, known as Minimum Demand.

Such boundaries are only mysterious if you don’t do Hypernomics.

Spy satellites, military satellites, and Unmanned Aerial Vehicles (UAVs or drones) all perform the same mission and face identical financial limits. Below is an Upper Demand Frontier that includes models of all three groups. With a slope of -1.38, is steep (inelastic).That means more money is spent on five Topaz Spy Sats (5*$9.4B = $47B) than the 19,000 Raven Drones (19,000 *$25K= $475M).The steeper (-1.96) Minimum Demand Frontier reveals that one Mercury Spy Sat ($2B) fetches more than 19,000 RQ-I4s (I9K*$3K = $57M).

Same Function, Different Form, Same Equation

California sunlight / Sweet Calcutta rain / Honolulu starbright / The song remains the same.
Led Zeppelin

Modern surveillance demands a lot of different platforms. The Russians run ELectronic INTelligence (ELINT) satellites over Hawaii, California, and the rest of the US (A). Western forces must get the same insight to be as well-informed.

We can get this data from airborne platforms outside of manned systems (such as the U-2 Dragon Lady, the E-3 Sentry, and the E-2C Hawkeye) by using satellites and Unmanned Air Vehicles (UAVs).

It turns out we can predict the Value (sustainable price) of Western Bloc satellites and UAVs using the same equation. In (B), with 30 Sats on the left and 30 UAVs on the right, we predict the Value of the US Mercury ELINT satellite using an equation considering 1) Payload, 2) Max MPH, 3) Altitude, and 4) Quantity sold. The Israeli Orbiter UAV (C) estimate using the same equation is highlighted in (D). With an adjusted R2 of 96.1%, its p-value is 8.83E-39.

As you might imagine, the Inner and Upper Demand Frontiers for these devices are highly correlated, too, giving direction on purchases.

More on that in another post.

Nailing the X-Ray and Gutting “The Law of Supply and Demand”

You can observe a lot by watching.
Yogi Berra

Dante Autullo went to a hospital complaining of nausea and a headache. A passing diagnosis might have been that he had the flu. But when his doctors asked him about what he had been doing, X-rays showed that as he was using a nail gun, a nail he thought whizzed past his head went into it instead (A). They operated; he’s okay.

Easy answers have a lure. After all, who wants to dive deeply into a flu case? But details matter. Easy answers aren’t always right. Just ask Dante.

The draw to misguided and overly simplistic phenomena applies to “The Law of Supply and Demand.” As we see in (B), given their postulates (i.e., flawed assumptions), they propose a single market equilibrium point. Every time they show such an example, it never has real-world data. It is always all made up.

I’m not going to stand for it. Neither should you.

Readers of this column know actual market behavior, based on verifiable data, looks more like (C), where buyers pay for aircraft cabin volume and speed (in the left-hand Value Space) as limited by their available funds (on the right-hand Demand Plane). Upcoming posts will give you more reasons to listen to reason.

Markets’ Visible Hand

Everything is theoretically impossible until it is done.
Robert Heinlein

Over 200 years ago, Adam Smith wrote that “[producers] are led by an invisible hand to make nearly the same distribution of the necessaries of life (Wealth of Nations, p. 540).”

The phrase “an invisible hand” is a metaphor for unseen market influences (A), still widely used in economics. It is a cousin to the maxim, “see what the market will bear,” addressing buyers’ product reactions. Proponents would have you believe that seeing these forces is impossible.

Sometimes, seeing what is invisible to the naked eye is as simple as flipping a switch. The Costa Concordia captain sailed into the Isola del Giglio (B). To prevent that disaster, all he had to do was turn on a computer that he had shut off and use its information.

Adam Smith had it all wrong.

If we’re using metaphors, using the “Visible Hand” to describe market workings is more fitting. As we see in (C), the S&P 500 formed an upper price limit on 2/20/23. It does that every day. In short, all buyers in all markets self-organize in ways we can describe and use.

To see how this works, watch the seminar recorded on Auguest, 29, 2023 further below:

How to Lose €10B+

The race is not always to the swift, nor the battle to the strong, but that’s the way to bet.
Damon Runyon

According to Harvard professor Clayton Christensen, nearly 30,000 new products are introduced yearly, and 95% fail.

But there are ways that one can help increase the potential for product success. It involves determining the Value, Demand, and Cost of goods and services before they launch. Buyers reveal how they Value the product features and their Demand. It is up to producers to figure out those parameters, along with their Costs. Not looking at all those variables in advance is a recipe for financial disaster.

You’re bound to fail if you placed a heavy bet on a program with long odds against you– but you went ahead with it, got it into production, and rode it out until it ran out of steam after losing tens of billions of Euros. That is the conclusion I reached for the Airbus A380 in my paper, “CSI EU: Cost Scene Investigation,” for which I won the ICEEA 2023 Best Modeling and Case Studies Track Paper. This step-by-step analysis gives you the framework for creating models that enhance your chances of being that one in 20 product that succeeds. Below is the video of the presentation:

Proper Production Possibility Curves

There are no solutions; there are only trade-offs
Thomas Sowell

Forget the “classic” choice model between guns and butter with its single imaginary frontier. Such notions offer no basis for action. Never settle for heuristics when you can have analytics. To reveal true alternatives, we’ll need to do some heavy lifting.

In 4D.

No, really.

In A, we find an aircraft Demand Frontier in yellow. If we want to make 100 units (Quantity – Dimension (Dim) 1), we find our price limited to $393M (Price – Dim 2). For 55 copies, our price could rise to $610M (purple lines). In A’s Value Space, the sustainable price goes up with range (Dim 3) and velocity (Dim 4) but down with added units; thus, the angled Value Response Surface for 55 units is higher than that for 100 units. They form straight lines in log space where they intersect their respective price ceilings (the horizontal yellow and purple planes in Value Space). In B’s linear space, those intersections form multiple curves revealing the proper trade-offs. The yellow line shows us we could build a plane with 10K in range, with a max V of just over 1400 KPH.

It takes work to find Demand and Value, but in the end, we get insight available nowhere else.

Markets Across Seven Dimensions

One should concentrate on getting interesting mathematics.
Paul Dirac

Let’s examine how markets work together across 7 dimensions.

Far from being some exotic mathematical anomaly, such arrangements occur daily across many markets. Please feel free to offer some feedback.

To make a pencil, given wood, you’ll need graphite.  Making a bike takes a frame and tires.  These markets are bonded—you can’t make a final product without some key pieces.  How do bonded markets such as jets and their engines interact across 7 dimensions?

Let’s look.

In the 7D diagram below (with log scaling in all directions), turbofan engines use Dimensions (Dims) 1-4.  As Specific Fuel Consumption (SFC, Dim 1) goes down and Max Thrust goes up (Dim 2), turbofan prices, reflecting their Value, moves up as well (Dim 3), with Quantities sold (Dim 4) limited by the market’s demand frontier (yellow line on the red, right-hand Demand Plane).  Making a new engine with a specified level of SFC and Max Thrust yields a value of the large green sphere, marked by “T,” at left.

That engine supports a new business aircraft model and accounts for a portion of the plane’s cost, marked by the large green sphere labeled “B.”  Aircraft Value goes up (Dim 3, shared with the engines) with Max MPH (Dim 5) and Cabin Volume (Dim 6), as limited by their Demand Frontier (Dim 7).  Such entanglements exist in all bonded markets.  They must be studied thoroughly to be optimized.

#hypernomics #markets #innovation #economics

Help Your Partner; Help Yourself

Together we stand, divided we fall;
come on now, people, let’s get on the ball and work together.
Canned Heat, Let’s Work Together

Upper Demand Frontiers form in every market outside of commodities. You can prove this by plotting shares for all S&P 500 companies on the horizontal axis against their sales prices on the vertical (best seen in log-log space). For any given day, you’ll find an Upper Demand Frontier takes shape.

Frontiers limit sales. How do you work around them?

Hypernomics enables us to see how interconnected markets work. In (A), the Boeing 787 Business Jet was, for a period, pushed up against its Demand Frontier (the dashed blue line). One of its compatible engines, the GE Genx-1B, found itself in a like condition, hard up against its Demand Frontier (in B, the dashed orange line). What to do?

If GE, whose engines make up about a quarter of the B787 cost, finds their Learning Curve (recurring costs, as the solid orange line) below their price limit, they could drop their prices and make more profits. That would enable Boeing to lower their B787 business jet price and do the same. Knowing your partner’s place in the market is key to making them and you more profits.

#hypernomics #profits #markets #partner