Why Keep Prices Low
Always deliver more than expected.
Larry Page, Former CEO of Google
Have you ever wondered how Elon Musk managed to become the wealthiest person in the world?
I know I did.
In the space industry, we knew that by selling SpaceX launch platforms for less than their projected Value, Musk drove SpaceX revenue higher. How might that strategy work in the Electric Vehicle (EV) market?
I found the top 25 best sellers in the EV market in 2024. Suppose you were to try to predict the EV Value. If you did, you’d find that it goes up with horsepower (as expected), curb weight (not expected, but since virtually every model had a five-star rating, added mass was a measure of crash survivability), and model sales (the Value for each subsequent delivery falls).
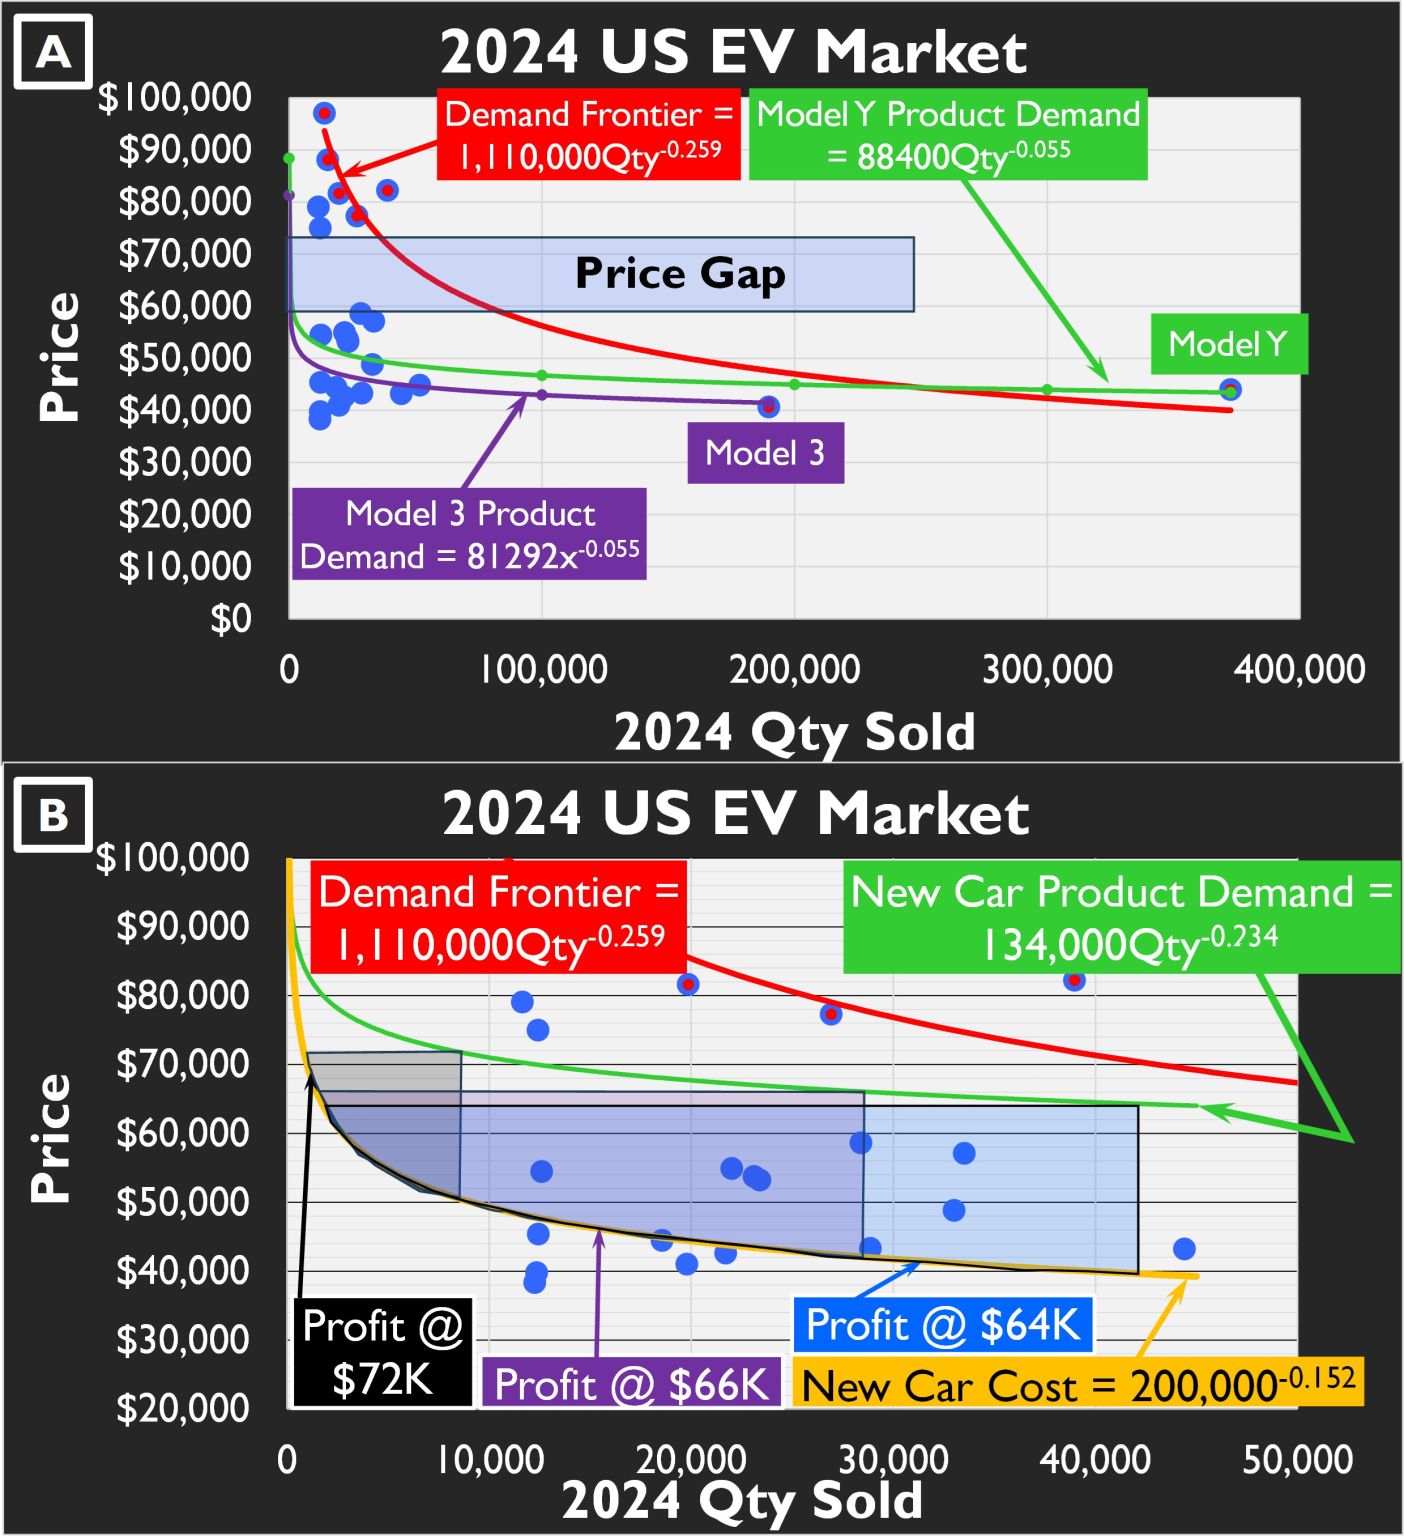
In (A), we observe that this market forms a well-correlated Upper Demand Frontier, with Tesla Model Y and Model 3 commanding the low-priced portion, where most of the market’s revenue lies. Between them, they control over half the revenue that the top 25 models produce. A company can make more money if it can drop a model’s price and cost simultaneously.
Suppose you wanted to enter this market. While curb weights are well distributed across it, there are no vehicles with more horsepower than the Ford F-150 Lightning (Pro SR) at 426 horsepower, or less than the BMW iX (xDrive5) with 516 horsepower. The target for a proposed new model aims to split that difference. At the time of the study, no model was priced between the Cadillac Lyriq (RWD Tech) at $58,590 and the Tesla Model S (Dual Motor) at $74,990. Rather than compete head-on in highly contested market spaces, you could decide to put yourself roughly in the middle of both of the horsepower and price gaps, with a curb weight of 5,000 pounds, 471 horsepower, and projected sales of 28K units in a year, and a target price of $66K for a vehicle, as we do in (B). These specifications form a New Car Product Demand Curve (in Green, which comes from our recurring price term in the regression analysis for Value in these models) and an assumed New Car Cost (Learning) Curve. The difference between the price and the recurring costs is profit.
Our car is nominally worth about $66K. If we sell it for $72K, we get the profits in the black-shaded box in (B), with the earliest possible recurring breakeven point. If we sell it for $66K, as designed, recurring breakeven comes later, but we make more profit, as shown by the purple-shaded area. Paring the price down another $2K to $64K drives a delayed unit breakeven point, but profits (in the blue-shaded area) grow.
While there are additional factors to consider here (movements over time, network effects, feature packages, etc.), it is clear that Hypernomics unlocks previously hidden market patterns, enabling enhanced profits.
And who wouldn’t want that?
#hypernomics #ev #evmarket